Timeline - Setup
TNG 7.1 adds the following new capability to the Chart Settings:
- default chart width
- Simile Timeline
Default Chart Width
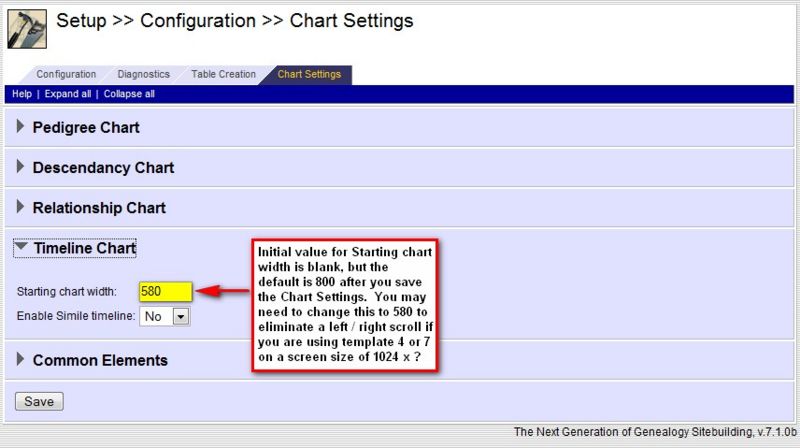
TNG 7.1 changed the default chart width for timelines from 500px to 800px. When you initially access the Timeline Chart within the Chart Settings, the field may be blank but once you save the settings it will change to 800.
If you are using Template 4 or 7 which have a left nav menu and your primary audience are using screens that are 1024px wide, you may want to change the default from 800px down to 580px to prevent a left/right scroll bar from generating.
Simile Timeline
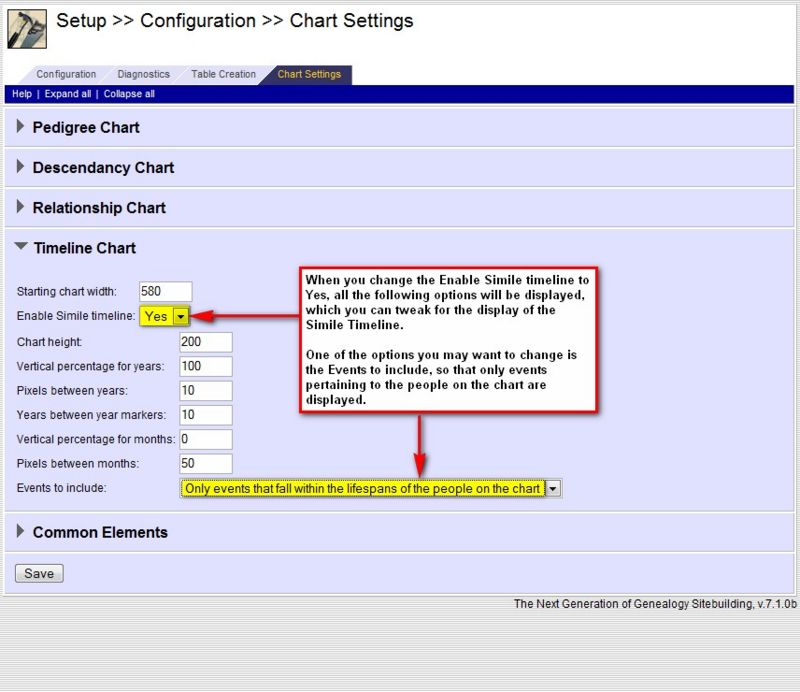
The default setting in the new Timeline section of Chart Settings is to not enable the Simile Timeline. So if you want to use the Simile Timeline, you will need to change the option to Yes.
Once you change the option to display the Simile Timeline, TNG will display additional options that can be changed.
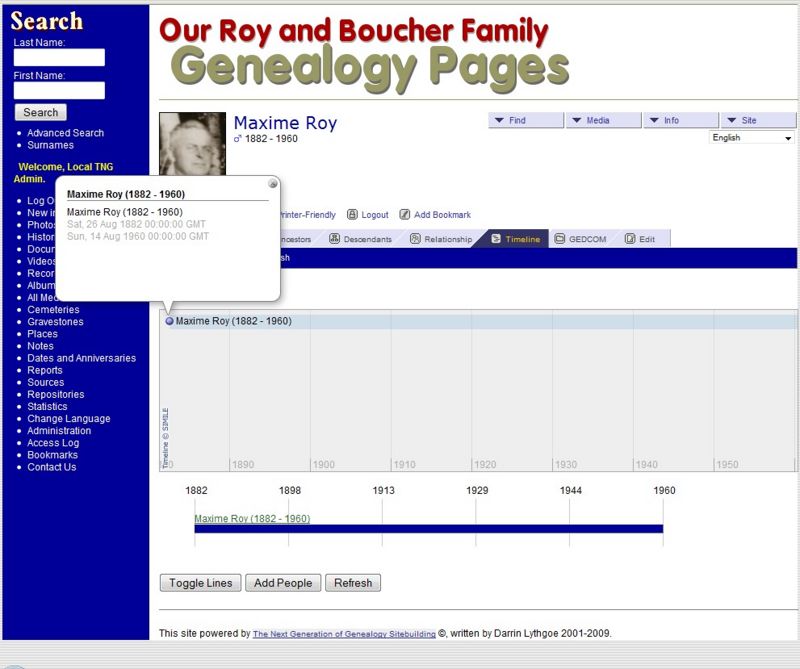
Note that if you do not have any Timeline Events defined, the Simile Timeline will not add any particular value to your Timeline page as can be seen in the following image.
Simile Timeline Settings
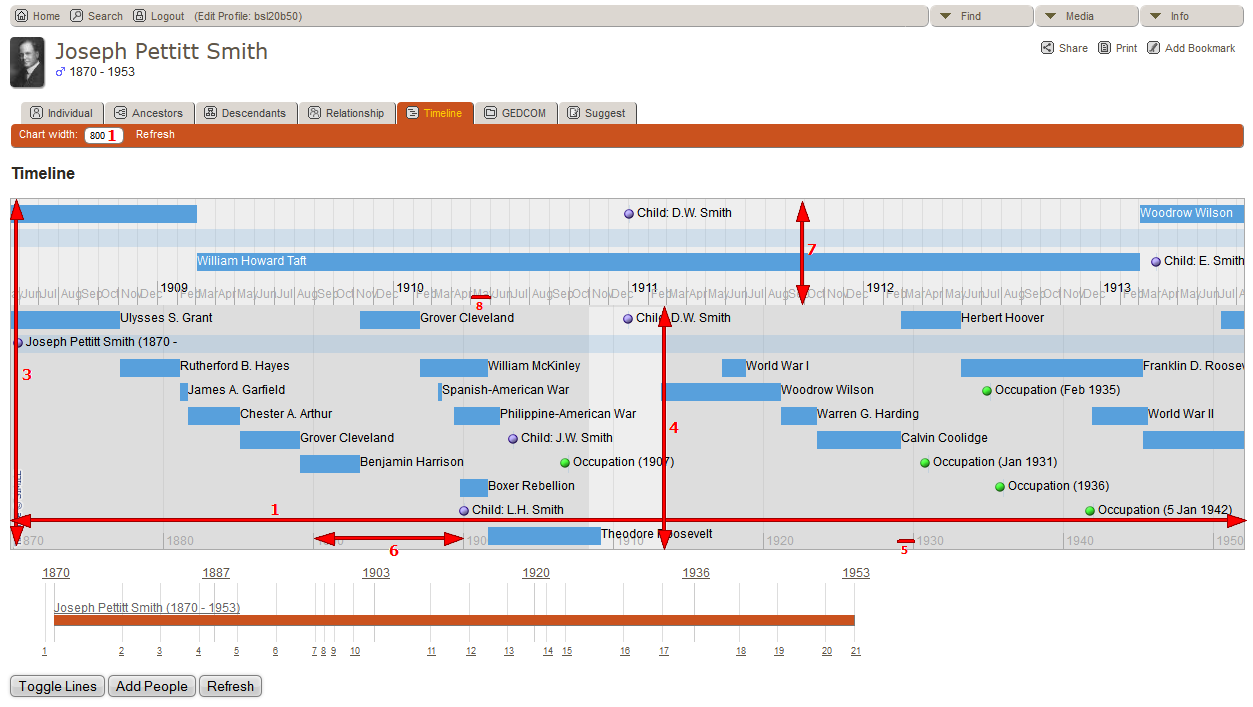
The screenshots below show the parameters modified by each setting. They also show settings that may be useful.
More detailed explanations are provided below.
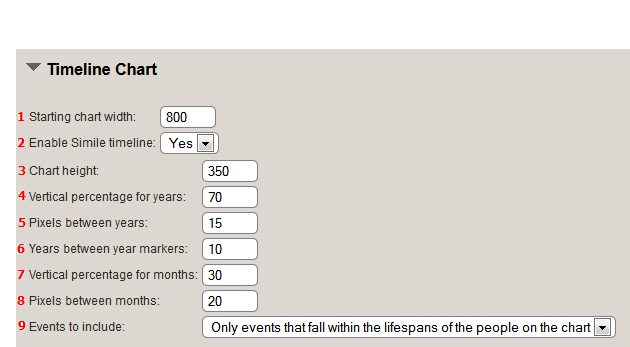
The Simile Timeline is made up of two timeline bands:
- Year band represented by number 4 in the image below
- Month band represented by number 7 in the image below, which is displayed below the year band in TNG V8 and above the Year band in TNG V9
1. Starting chart width
This is the width in pixels of the small bar timeline below the Simile timeline. The Simile timeline resizes based on the size and resolution of the viewing screen. This is the only parameter that can also be modified by a site visitor. Depending on the resolution of the monitor that is used to view the timeline, a larger or smaller chart width may be appropriate. If the timeline width exceeds the width and resolution of the screen used to view the timeline, scroll bars will need to be used to view the entire timeline.
2. Enable Simile timeline
To use the Simile timeline, select 'Yes'. If this option is set to 'No', only the small timeline bar will be displayed with lines hyperlinked to the corresponding timeline event.
3. Chart height
This setting determines the total height in pixels of the timeline chart. If the chart height is set too large, there will be wasted empty space at the bottom of the chart. If it is set too small, events will fall off of the chart and won't be visible.
4. Vertical percentage for years
This setting determines the vertical percentage of the timeline chart that represents the lower, or 'years' portion of the timeline chart. This setting plus the Vertical percetage for months should add up to 100. Going above 100% will push part of the chart outside the visible bounds of the chart. Conversely, if these two settings total less than 100%, the two sections will not fill the bounds of the chart and you will end up with a third blank section at the bottom (if the chart height is not sufficient, events that fall off the chart will overlap this blank section). Setting the vertical percentage for years to zero will eliminate the 'year' portion of the Simile timeline. Likewise, setting 'vertical percentage to months' to zero will eliminate the 'months' portion of the Simile timeline.
5. Pixels between years
This setting determines the number of pixels between years in the lower portion of the Simile timeline. The width of the Simile timeline divided by this setting determines how many years are spanned by the lower portion of the Simile timeline. The screen resolution along with the template used determine the full width of the Simile timeline, so some judgement and calculation should be used to determine the best setting to use here. For example, if a screen has a resolution of 1440 x 900 and TNG is using template 7, which uses a side menu, you end up with a Simile timeline that is pretty close to 1200 pixels wide. If the 'pixels between years' is set to 15 on in this case, the lower portion of the Simile timeline will encompass 80 years. If everything is the same, but template 8 (which does not use a side menu) is used, the lower portion of the Simile timeline will encompass about 93 years (1440 minus a few pixels for padding divided by 15).
6. Years between year markers
This setting determines the interval between markers on the Simile timeline. For example, if this is set to 10, there will be a line and the year every decade (i.e. 1870, 1880, 1890, etc.). If this setting is too small, the markers will be too close to read the years.
7. Vertical percentage for months
This setting determines the vertical percentage of the timeline chart that represents the upper, or 'months' portion of the timeline chart. This setting plus the Vertical percentage for years should add up to 100. Going above 100% will push part of the chart outside the visible bounds of the chart. Conversely, if these two settings total less than 100%, the two sections will not fill the bounds of the chart and you will end up with a third blank section at the bottom (if the chart height is not sufficient, events that fall off the chart will overlap this blank section). Setting the vertical percentage for years to zero will eliminate the 'year' portion of the Simile timeline. Likewise, setting 'vertical percentage to months' to zero will eliminate the 'months' portion of the Simile timeline.
8. Pixels between months
Similar to setting #5 above, this setting determines the number of pixels between months in the upper portion of the Simile timeline. The width of the Simile timeline divided by this setting determines how many months are spanned by the upper portion of the Simile timeline. The screen resolution along with the template used determine the full width of the Simile timeline, so some judgement and calculation should be used to determine the best setting to use here. For example, if a screen has a resolution of 1440 x 900 and TNG is using template 7, which uses a side menu, you end up with a Simile timeline that is pretty close to 1200 pixels wide. If the 'pixels between months' is set to 20 on in this case, the upper portion of the Simile timeline will encompass about 60 months or 5 years.
9. Events to include
This setting determines whether to include all timeline events in the Simile timeline or only those events that fall within the person's lifetime. If the option is chosen to only show those events that fall within a person's lifespan, more events will appear on the Simile timeline by adding more people to the timeline.
